University of Washington
Design Thinking Process for University of Washington’s food services.
Design Thinking I Service Design I Food Services
Design Question
How can we help University of Washington food services’ grocery store and cafe employees efficiently manage expiring prepared foods?
Problem
Today, the burden of managing the expiring food on the shelves of grocery stores and quick-service restaurants (QSRs) often falls on employees. In fact, most supermarket employees use some combination of tedious, visual checking and managing Excel spreadsheets to remove or discount expiring products on their shelves (Yoobic.com) and it’s no exception for food services employees at UW markets and cafes. Our team sought to understand how we can help UW food services employees efficiently manage expiring prepared foods as one small step in improving the food waste process across multiple food locations at UW.
User Research
Research Methodology
To understand the expired food process at UW Food Services locations and identify the pain points in the current process, we used three separate research methodologies:
Contextual Inquiry: Shadowing store staff as they pulled expired foods and taking pictures of the process
User Interviews: Semi-structured Interviews with both staff and managers
Secondary Research: Research into grocery store processes to get a fuller picture of the process from order to sale/disposal

Personas
From our user research we were able to identify three key personas as the main users of our system from both the UW Food Services management and staff.

Manager

Student Coordinator

Student Associate
After collecting qualitative data from our research, we synthesized that data using affinity mapping to uncover the below key insights and trends:
The UW food services process requires staff to visually check expiration, sell by and best by dates, mark information for waste log and update digital inventory systems making it prone to human error.
The recording step of the food waste process, in particular, is a major pain point for our users.
There’s a lack of consistency within the food waste processes across UW market and cafe locations.
Prepared and perishable foods pose a more significant food waste problem for UW food services than packaged foods since they expire more frequently.

Affinity Mapping
Design
With key insights and user personas we were then able to begin the ideation stage, starting with a design brainstorm on how to solve each of the problems from our research.

Ideation & Brainstorming


Using storyboarding we were then able to combine these solutions into one larger design that took a more comprehensive and holistic view of the UW Food Services process. The storyboard also forced us to think about the constraints of our design to build something realistic for a university food services organization. We then sketched out our brainstormed ideas to add more detail to the solutions.

Sketching & Storyboard
By plotting out how the data flows from one component to the other, we were able to understand key tasks and actions for each of our three components in mind (scale, scanner and dashboard).

Data & User Flow
Once an initial design had started to coalesce and we decided that the system would have multiple components with an overarching database, we diagramed the data flow and service blueprint to help provide structure for the wireframes.

Once an employee scans an item, data is pulled from the Etsaw Doof! database on how to handle the item (Donate | Compost) and data is surfaced on the scanner. Once the checklist is complete and sent to the manager, the item's information and handling methods are all sent to Etsaw Doof! Database and syncs up with Point of Sales and Inventory Management System.

Etsaw Doof! system sends waste log information and displays it on the manager’s dashboard through data visualizations. Etsaw Doof! System also surfaces recommendations in xq form of tasks based on analyzing what was sold ( data from Point of Sales data) and what was purchased (data from Inventory Management System).
The service blueprint helped us understand what is happening both in the front-end and the back-end of our system as the user takes actions. This gave us an overview of how our system will operate and what we need to deliver to our users for this to be a successful journey.


Following their standard process, employees prep and weigh food on a scale where they input expiration dates, prices, weight, etc. to print a scannable label.
Once the label is printed, expiration date data gets sent to Etsaw Doof! Sold items data from point of sales is synchronized with the Etsaw Doof! Database. In the backend, the system scrapes the database for expired items (or expiring soon), this info gets sent to the scanner.
Using our storyboard, service blueprint and data flow diagram we then began to create initial prototypes of the key components of our Etsaw Doof! system.

Prototypes & Usability Testing


After usability testing our prototypes with UW market staff and managers we made critical changes to the designs based on feedback.
Scanner: For staff we simplified the experience adding clarity to action items and an ability to edit information manually.
Add individualized checklist of expired foods to the main scanning page
Enable users to edit scanned items before submitting to the manager
Simplified the experience by changing the color palette and reducing pop up screens
Edited down word content and made text content more concise so that next steps and recommendations were more clear to users
Show user progress as they scan through the list


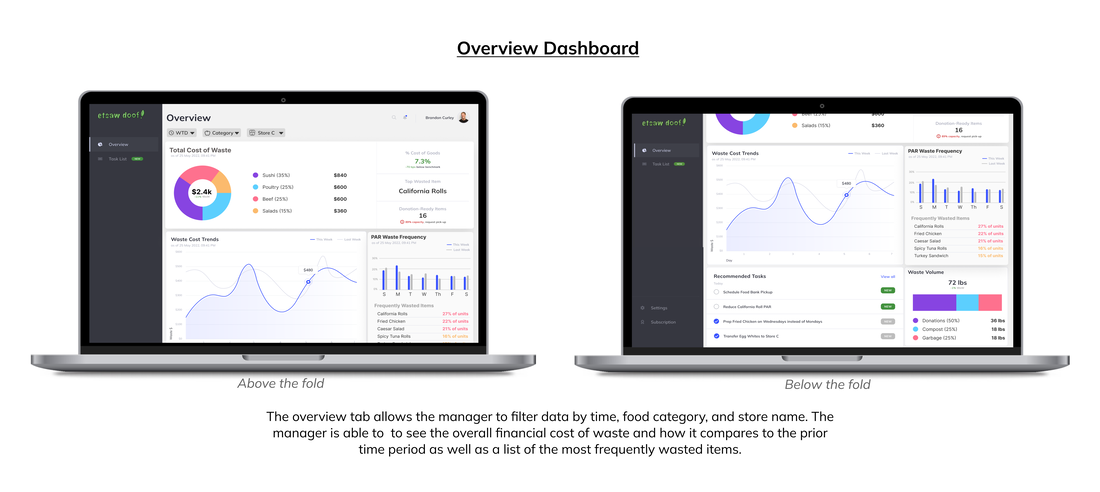
Dashboard: For managers we rearranged and highlighted key metrics and added a separate task list of recommended next steps from the data.
Simplify the experience with focus on a clear single metric:
Cost of food waste week over week.
Reduce the number of individual charts within the dashboard from 9 to 5
Adjust the waste volume to make it a visualization that also breaks down the % of waste by volume that is either donated, composted, or thrown in the garbage
Highlight the top wasted food item at the top
Turn the waste frequency table into a bar chart to easily see trends and highlight the top wasted items based on severity.
Highlight the number of items scanned for donation and add an alert to notify when to call for a pick-up
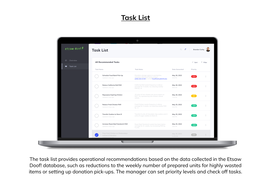
Break out the to-do list of tasks on a completely separate tab with more specific details on each task with the ability to prioritize and “check things off”
The final prototype remained a three-component system, powered by our Etsaw Doof! database with usability enhancements from our usability testing. To help UW grocery stores manage food waste, we designed an integrated set of employee tools that:
Digitizes expiration dates in a central database
Enables employees to efficiently check for, log, and handle expired items via a mobile scanner
Provides managers a unified dashboard view of waste stats and operational recommendations
This integrated solution not only reduces the burden on employees and managers, it also impacts the climate. Not only do we enable UW grocery stores to better manage food waste, we help them to reduce it.